## install libraries

#%pip install rasterio
#%pip install matplotlib
#%pip install pandas
#%pip install seaborn
#%pip install tabulate
This notebook walks you through the final suitability index creation, and evaluation of results (sensitivity analysis is handled in the Sensitivity-Analysis.ipynb notebook) both use the same python functions from SuitabilityMappingTools.py
In [1]:
In [1]:
import SuitabilityMappingTools as smt
import os
TIFF_DIR = r'G:\Data\Thinning_Recharge_Final_Data\Final_Scaled_Layers\resampled'
#smt.get_dir_info(TIFF_DIR) # run this if you want to check the sizes of the files in the directory, if they are different you might need to resample them, esnure they are the same projection
SuitabilityMappingTools has been loadedIn [2]:
""" In this step we select which files we want to combine to create the SbII index, when you run this the
select_tif_files() function it shows you all the data that is available and you choose the SbII_out, sSF_AZH8_rsmp, SMII_out, and VDI_out by their indices """
files_list = smt.select_tif_files(TIFF_DIR)
Available .tif files:
0: sBA_AZH8_rsmp
1: SbII_out
2: sCC_AZH8_rsmp
3: sLD_5_10_AZH8_rsmp
4: SMII_out
5: sPK_5_10_AZH8_rsmp
6: sPm_AZH8_rsmp
7: sPo_AZH8_rsmp
8: sSF_AZH8_rsmp
9: sSF_pp
10: sSoilK_AZH8_rsmp
11: sTRMI_AZH8_rsmp
12: Suitability_out
13: VDI_out
Enter the indices of the files you want to select (comma-separated)
In [3]:
# not lets set the weights for each of the files
file_list_w = smt.define_weights(files_list)
smt.check_weights(file_list_w)
smt.create_weighted_index(file_list_w, 'Final_Suitability')
Current file weights:
SbII_out.tif: 0.25
SMII_out.tif: 0.25
sSF_pp.tif: 0.25
VDI_out.tif: 0.25

Enter new weights (comma-separated). Make sure they sum to 1.

Current file weights:
SbII_out.tif: 0.2
SMII_out.tif: 0.4
sSF_pp.tif: 0.2
VDI_out.tif: 0.2
If weights are incorrect, run define_wights() function to change
output_file_directory: G:\Data\Thinning_Recharge_Final_Data\Final_Scaled_Layers\resampled\weighted_layers

Current file weights:
SbII_out.tif: 0.2
SMII_out.tif: 0.4
sSF_pp.tif: 0.2
VDI_out.tif: 0.2

Generating weighted raster...
✅ Weighted raster saved successfully: G:\Data\Thinning_Recharge_Final_Data\Final_Scaled_Layers\resampled\weighted_layers\Final_Suitability.tif
✅ File G:\Data\Thinning_Recharge_Final_Data\Final_Scaled_Layers\resampled\weighted_layers\Final_Suitability.tif saved successfully. Size: 3410502788 bytes

Metadata saved successfully!
c:\Users\rl587\Documents\GitHub\ATUR-Thinning-to-enhance-recharge\notebooks\SuitabilityMappingTools.py:336: UserWarning: set_ticklabels() should only be used with a fixed number of ticks, i.e. after set_ticks() or using a FixedLocator.
ax.set_yticklabels([f'{int(label/1000)}k' for label in ax.get_yticks()])✅ Histogram saved to G:\Data\Thinning_Recharge_Final_Data\Final_Scaled_Layers\resampled\weighted_layers\Final_Suitability.png
✅ Histogram data saved to G:\Data\Thinning_Recharge_Final_Data\Final_Scaled_Layers\resampled\weighted_layers\Final_Suitability_histogram.txt
Count of pixels (excluding no-data pixels): 23161028
Percentage of pixels in bin 0: count = 12 : 0.00%
Percentage of pixels in bin 1: count = 2140471 : 9.24%
Percentage of pixels in bin 2: count = 825023 : 3.56%
Percentage of pixels in bin 3: count = 1485184 : 6.41%
Percentage of pixels in bin 4: count = 3583670 : 15.47%
Percentage of pixels in bin 5: count = 6159956 : 26.60%
Percentage of pixels in bin 6: count = 6943770 : 29.98%
Percentage of pixels in bin 7: count = 1967515 : 8.49%
Percentage of pixels in bin 8: count = 55427 : 0.24%
Percentage of pixels in bin 9: count = 0 : 0.00%'G:\\Data\\Thinning_Recharge_Final_Data\\Final_Scaled_Layers\\resampled\\weighted_layers\\Final_Suitability.tif'In [4]:
output_dir = r'G:\Data\Thinning_Recharge_Final_Data\Final_Scaled_Layers\resampled\weighted_layers'
smt.plot_layers(output_dir)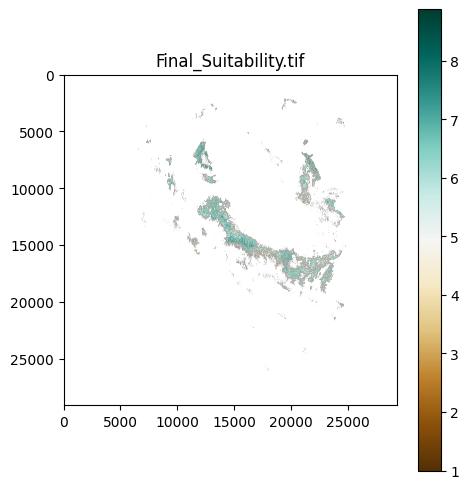
In [7]:
final_suitability_tif = r'G:\Data\Thinning_Recharge_Final_Data\Final_Scaled_Layers\resampled\weighted_layers\Final_Suitability.tif'
smt.plot_histogram(final_suitability_tif,title='0.2-0.4-0.2-0.2') # this will plot the histogram of the final suitability index
c:\Users\rl587\Documents\GitHub\ATUR-Thinning-to-enhance-recharge\notebooks\SuitabilityMappingTools.py:336: UserWarning: set_ticklabels() should only be used with a fixed number of ticks, i.e. after set_ticks() or using a FixedLocator.
ax.set_yticklabels([f'{int(label/1000)}k' for label in ax.get_yticks()])✅ Histogram saved to G:\Data\Thinning_Recharge_Final_Data\Final_Scaled_Layers\resampled\weighted_layers\Final_Suitability.png
✅ Histogram data saved to G:\Data\Thinning_Recharge_Final_Data\Final_Scaled_Layers\resampled\weighted_layers\Final_Suitability_histogram.txt
Count of pixels (excluding no-data pixels): 23161028
Percentage of pixels in bin 0: count = 12 : 0.00%
Percentage of pixels in bin 1: count = 2140471 : 9.24%
Percentage of pixels in bin 2: count = 825023 : 3.56%
Percentage of pixels in bin 3: count = 1485184 : 6.41%
Percentage of pixels in bin 4: count = 3583670 : 15.47%
Percentage of pixels in bin 5: count = 6159956 : 26.60%
Percentage of pixels in bin 6: count = 6943770 : 29.98%
Percentage of pixels in bin 7: count = 1967515 : 8.49%
Percentage of pixels in bin 8: count = 55427 : 0.24%
Percentage of pixels in bin 9: count = 0 : 0.00%Histogram Data for Final_Suitability.tif
Total count of pixels (excluding no-data): 23161028 Mean pixel value = 5.20
| Bin | Count | Percentage of Total Pixels | Min Value | Max Value | Area (ha) |
|---|---|---|---|---|---|
| 0 | 12 | 0.00% | 0.00 | 1.00 | 1.08 |
| 1 | 2140471 | 9.24% | 1.00 | 2.00 | 192642.39 |
| 2 | 825023 | 3.56% | 2.00 | 3.00 | 74252.07 |
| 3 | 1485184 | 6.41% | 3.00 | 4.00 | 133666.56 |
| 4 | 3583670 | 15.47% | 4.00 | 5.00 | 322530.30 |
| 5 | 6159956 | 26.60% | 5.00 | 6.00 | 554396.04 |
| 6 | 6943770 | 29.98% | 6.00 | 7.00 | 624939.30 |
| 7 | 1967515 | 8.49% | 7.00 | 8.00 | 177076.35 |
| 8 | 55427 | 0.24% | 8.00 | 9.00 | 4988.43 |
| 9 | 0 | 0.00% | 9.00 | 10.00 | 0.00 |
| Pixels > 5 | Pixels > 6 | Pixels > 7 | Total Pixels | |
|---|---|---|---|---|
| Count | 15,126,668 | 8,966,712 | 2,022,942 | 23,161,028 |
| Percentage | 65.33% | 38.70% | 8.73% | 100.00% |